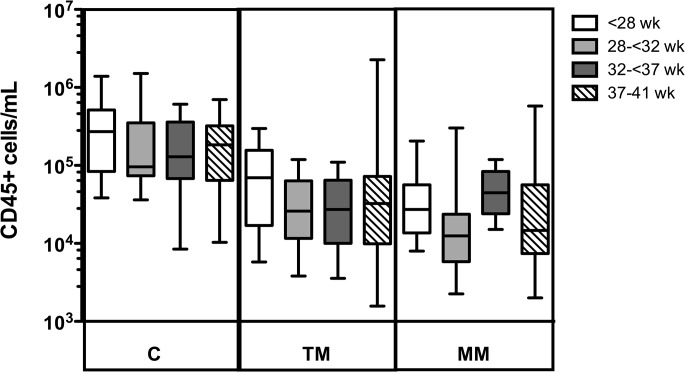
Fig 3. Leukocyte concentrations in breast milk samples.
Boxplots showing the total concentration of leukocytes (cells/mL) on a log scale in colostrum (C, n = 41), transitional milk (TM, n = 47), and mature milk (MM, n = 46), in extremely preterm (white), very preterm (light grey), moderately preterm (dark grey) and term (striped) donors.

