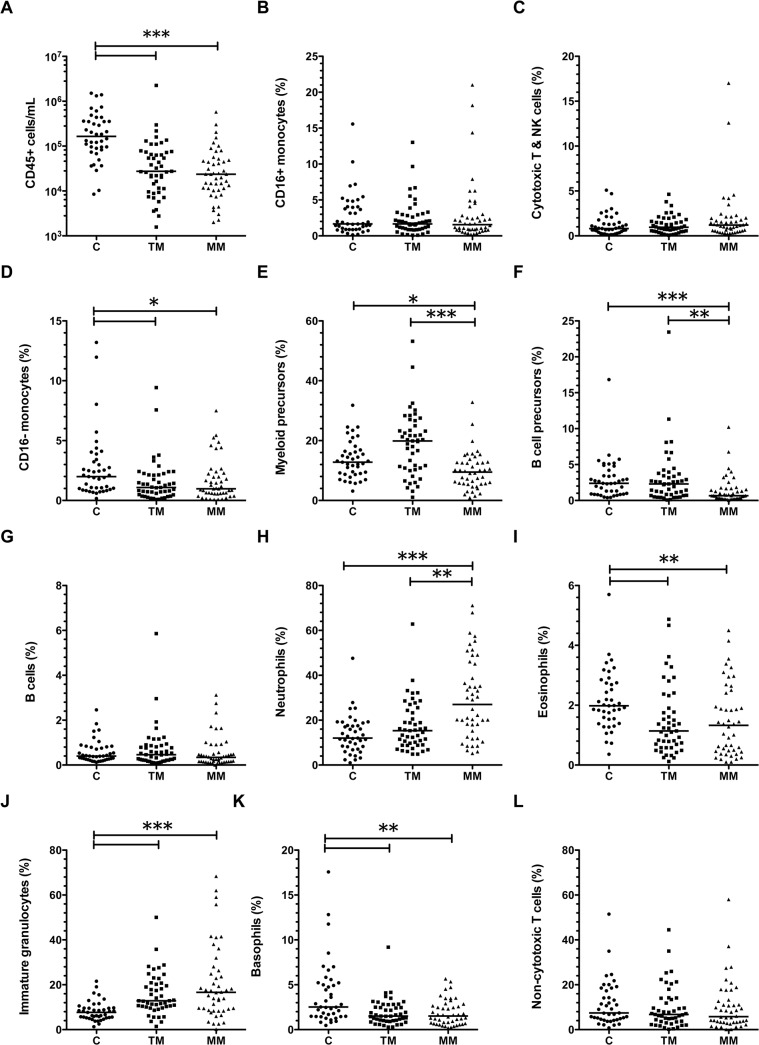
Fig 4. Changes to the composition of breast milk through the first month of lactation.
Line shows the median value for that milk sampling time point. Data show A) concentrations of total CD45+ cells in colostrum (C), transitional milk (TM) or mature milk (MM); B-L) frequencies of leukocyte subsets in colostrum (C), transitional milk (TM) and mature milk (MM) from all donors. *p<0.05 in post-test comparing different stages of lactation; for each comparison, number of symbols indicates p-value (*p<0.05, **p<0.01, ***p<0.001).

