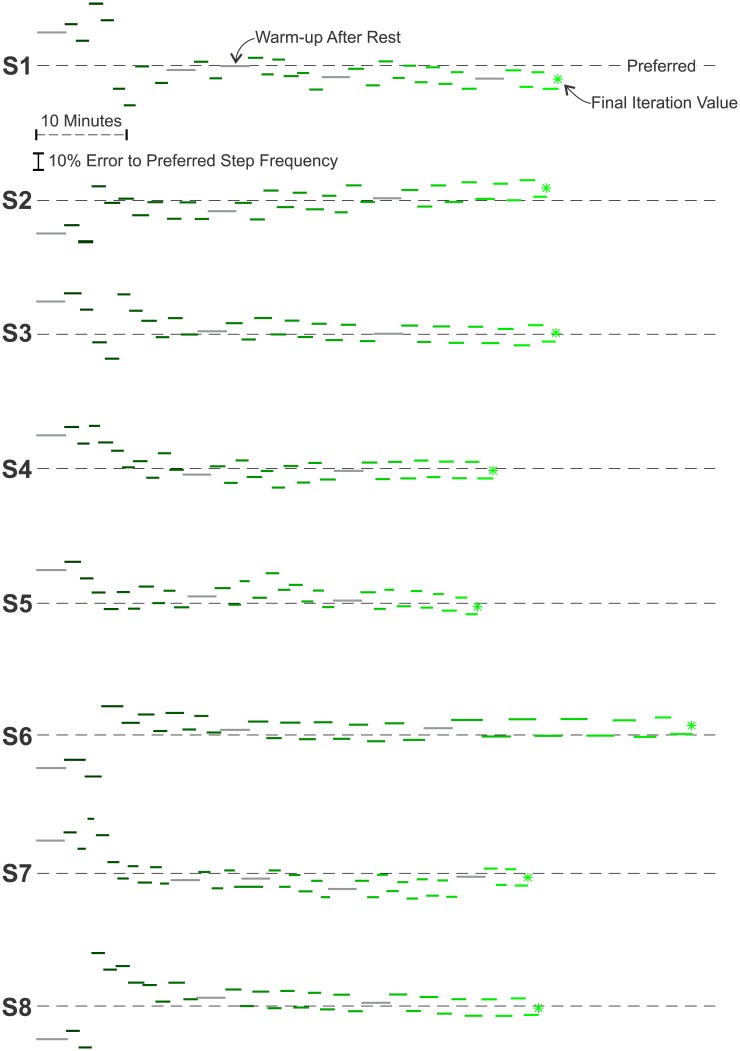
Fig 5. Convergence of the Instantaneous Cost Gradient Search Method.
The lines indicate the prescribed step frequencies over the course of the experiment. The experiment begins with an incorrect guess of the optimal step frequency that is randomly selected to be either 20% above or below the subject’s preferred step frequency. After a warm-up period, the step frequency is perturbed above and below the guess. The measurements of oxygen consumption during this perturbation process are used to estimate the slope of the underlying relationship between energetic cost and step frequency. This slope, or gradient, is used to update the guess of the optimal step frequency. Though the performance of the algorithm varied between subjects, the algorithm was always able to approach the energetic minimum. The average total walking-time was 56.5 minutes and the mean relative error of the final iteration value to the subject’s preferred step frequency was −0.29% ± 4.77% (mean ± SD). The lightening of shades indicates the progress of time.

