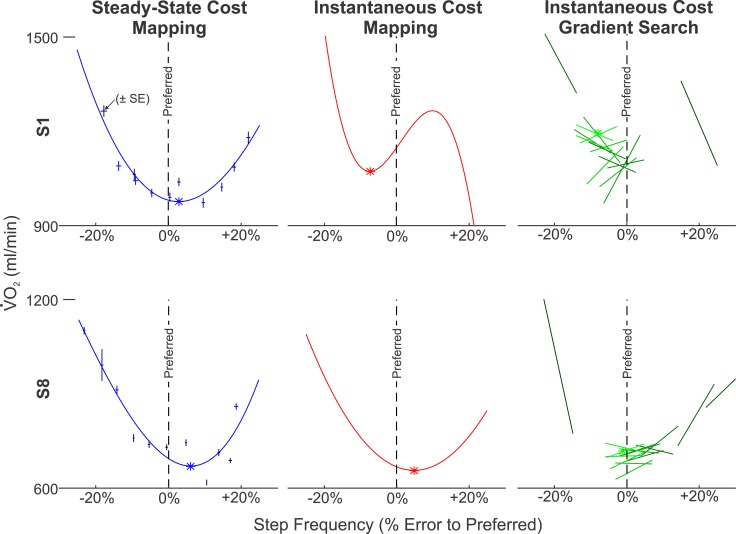
Fig 6. Examples of Response Surface Estimates of the Three Methods.
Data are shown for Subject 1 and Subject 8 (poor and good performance of Instantaneous Cost methods respectively). This figure illustrates the third-order polynomial fit to the means (± SE) in the Steady-State Cost Mapping method, the third order polynomial response surface that best predicts the measures from the Instantaneous Cost Mapping, and the series of linear response surfaces used to update the parameter guess in the Instantaneous Cost Gradient Search (the lightening of shades indicates the sequence of the fits). The linear response surfaces of the Instantaneous Cost Gradient Search for Subject 1 show a much higher degree of variability than Subject 8. This led the algorithm to converge at a value somewhat below the subject’s preferred step frequency (worse than any other subject). Interestingly, the Instantaneous Cost Mapping for Subject 1 estimated a similarly low minimum. For subject 8, the linear response surfaces are more regular, leading the gradient search algorithm to outperform both of the mapping methods.

