
Fig 2.
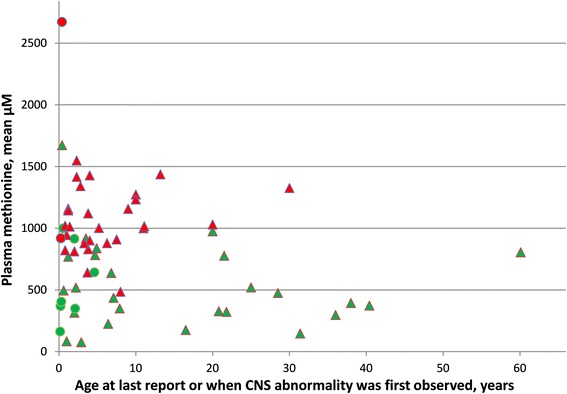
Plasma methionine concentrations for patients on normal diets without (green) or with (red) evidence of CNS abnormalities. Green values are plotted against age at last report; red values, against age at which CNS abnormality was first found. Triangles indicate mean methionine values at ages ≥ 5 months; circles indicate mean methionine values at ages < 5 months (if values at older ages are not available; and plotted against age at last report)