
Fig. 3.
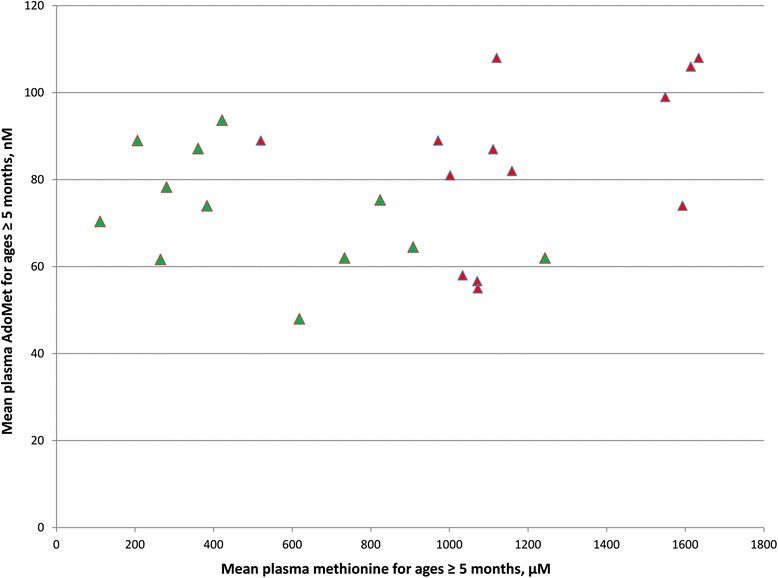
Plasma AdoMet as a function of plasma methionine. Symbols are the same as those used in Fig. 2. For each patient the mean plasma methionine concentration on normal diets at ages ≥ 5 months is plotted against the mean plasma AdoMet concentration on normal diets at ages ≥ 5 months. Patients without and with evidence of CNS abnormalities are shown, respectively, by red or green markers