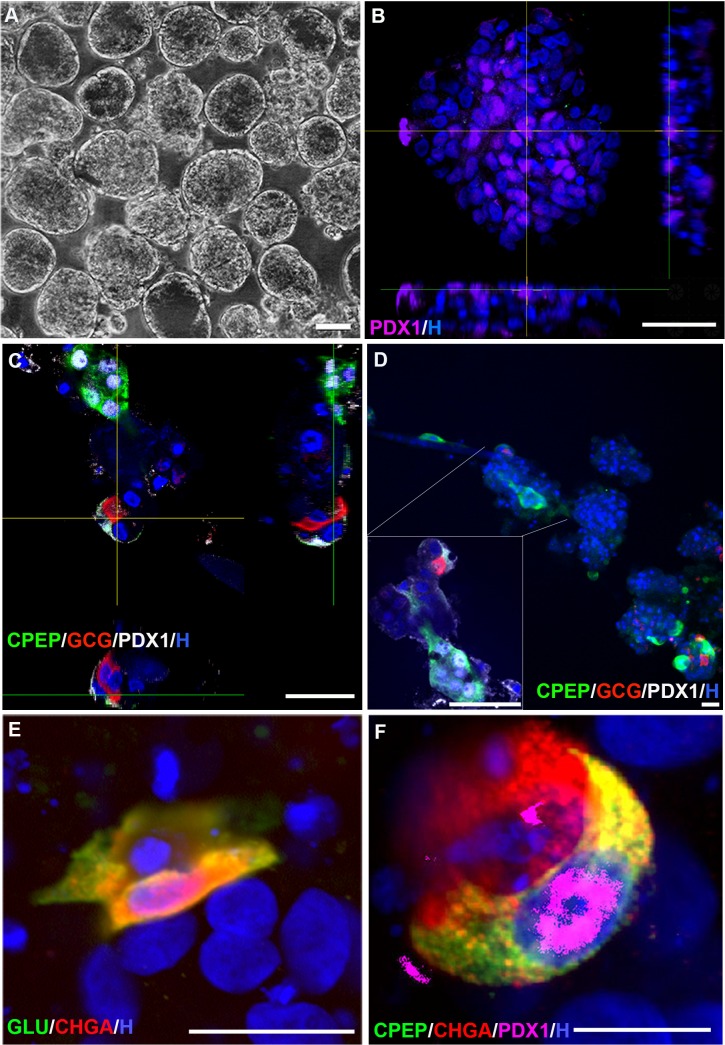
Fig 5. Expression of hormones, chromogranin A and PDX1 by CD133+ cells following in vitro differentiation.
A, Phase microscopic image of pancospheres on day 6 of formation. Scale bar is 100 μm. B, Pancreatic and duodenal homeobox 1 (PDX1) expression in a day 6 pancosphere. Scale bar is 50 μm. C,D, Orthogonal analyses of PDX1 / glucagon (GCG) and PDX1 / insulin C-peptide (CPEP) coexpression in day 21 pancospheres. 1 μm optical sections, scale bar is 50 μm. Inset box in D is magnified and rotated confocal reconstruction of cells indicated by lines. E, Coexpression of GCG and chromogranin A (CHGA) by cells within a day 21 pancosphere. Scale bar is 20 μm. F, Coexpression of CPEP, CHGA and PDX1 by cells within a day 21 pancosphere. Scale bar is 10 μm. B-F, Nuclei stained with Hoechst 33342 (H).

