Figure 2.

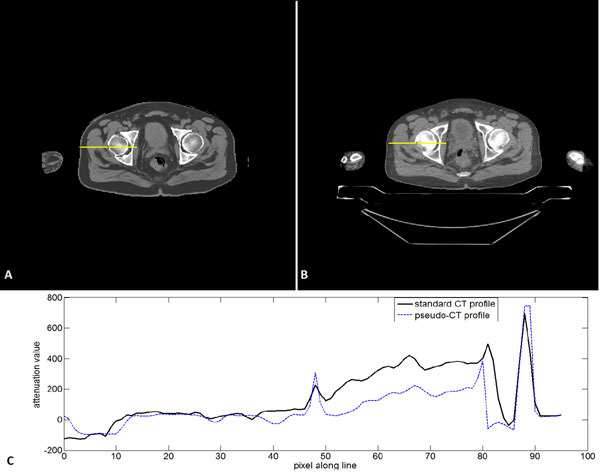
An example of a generated pseudo-CT slice (A) and its corresponding standard CT slice (B). Profiles over the line are plotted underneath (C).

An example of a generated pseudo-CT slice (A) and its corresponding standard CT slice (B). Profiles over the line are plotted underneath (C).