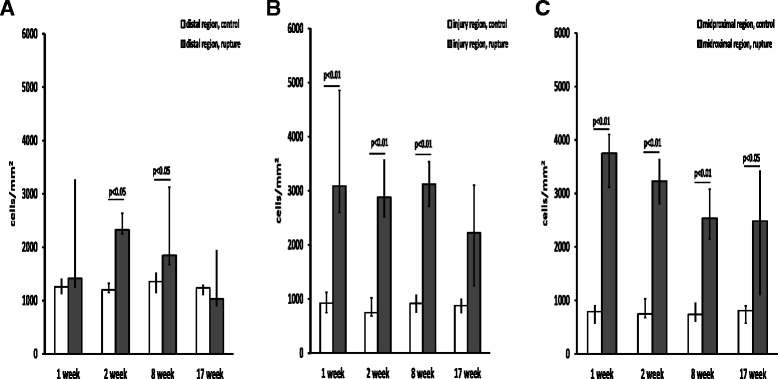
Fig. 6.

Cell density in ruptured vs contralateral control tendon. Total cell numbers/mm2 in (a) the distal region, (b) the injury region and (c) the midproximal region at one, two, eight and 17 weeks post-rupture. A total of six animals were evaluated at each time point. The p values in the figure represent comparisons between the control (left leg n = 6) and ruptured (right leg n = 6) tendon samples at each time point. Values are expressed as the median with IQR as error bars
