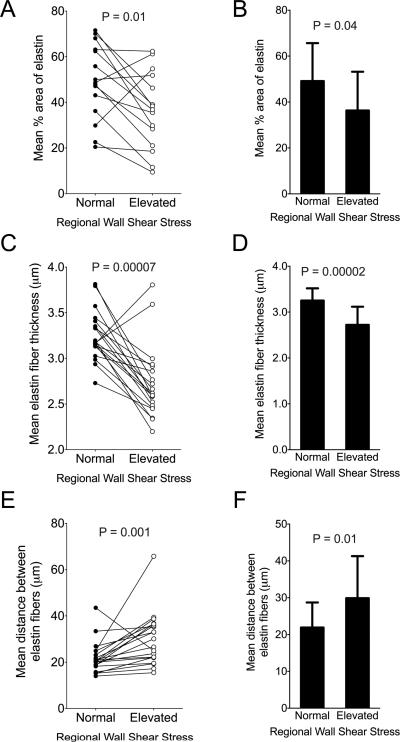
FIGURE 2. Metrics of Elastin Fiber Architecture.
Elastin fiber characteristics from Verhoeff-Van Gieson elastin staining for patient pairs (A, C, E) and cumulative group means (B, D, F) for aortic wall subjected to normal and elevated WSS are shown. Total percent area of elastin staining was decreased in regions of elevated WSS compared to normal WSS (A, B), and remaining fibers were thinner (C, D). Greater distances between intact adjacent elastin fibers were observed in regions of elevated WSS (E, F). Abbreviations as in Figure 1.

