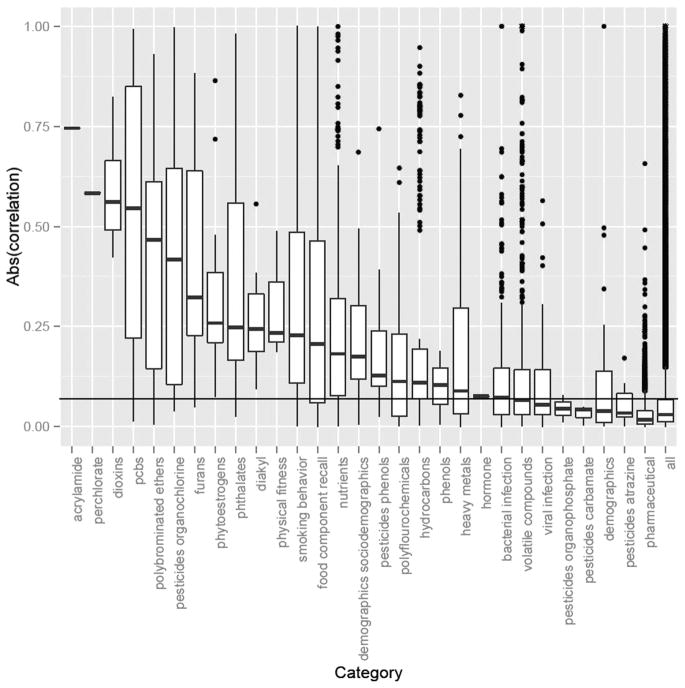
Figure 1.
Within-category absolute value of correlations (Spearman or biserial). Boxplot illustrates IQR (25–75th percentile) with median in the middle of the box. Only one pair of correlations was estimated for acrylamide and perchlorate exposures. Outliers outside of the 99th percentile are shown in actual points. We estimated significance of correlations through ‘permutation’ testing, randomly shuffling exposures to estimate correlation thresholds under the null distribution of no correlation. The horizontal black line denotes the 95th percentile of all ‘permuted’ correlations. ‘all’: denotes correlation across all pairs of variables available.

