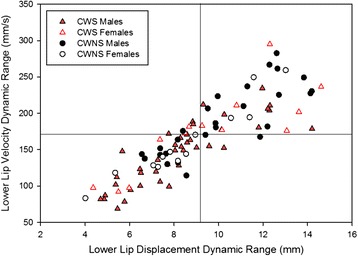
Fig. 4.

Dynamic ranges for “Buy Bobby a puppy.” Data points from each participant reveal their average lower lip displacement dynamic range plotted against their average velocity dynamic range. The vertical and horizontal lines in this graph show the median value for the dynamic ranges for the CWNS. The lower left quadrant of the graph contains data from participants with the smallest displacement and lowest velocity dynamic ranges. Conversely, the upper right quadrant contains data from those participants with the largest displacement and highest velocity dynamic ranges
