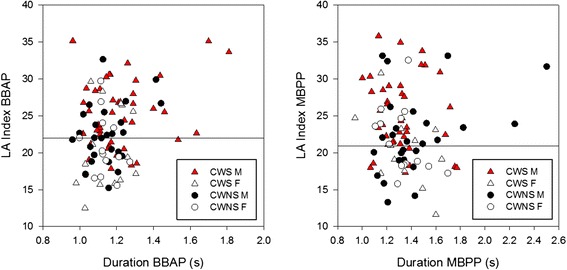
Fig. 5.

An average LA variability index for each participant is plotted against his/her average duration for “Buy Bobby a puppy” (BBAP-left) and “Mommy bakes potpies” (MBPP-right). The horizontal lines in each graph show the median LA index for the CWNS. Higher scores on the y-axis are associated with greater articulatory movement variability
