
Fig 5. Bayesian skyline plot illustrating Pleistocene increase and Holocene decline in population size of western Urocyon based on 785 bp of concatenated cytochrome b and D loop sequence data.
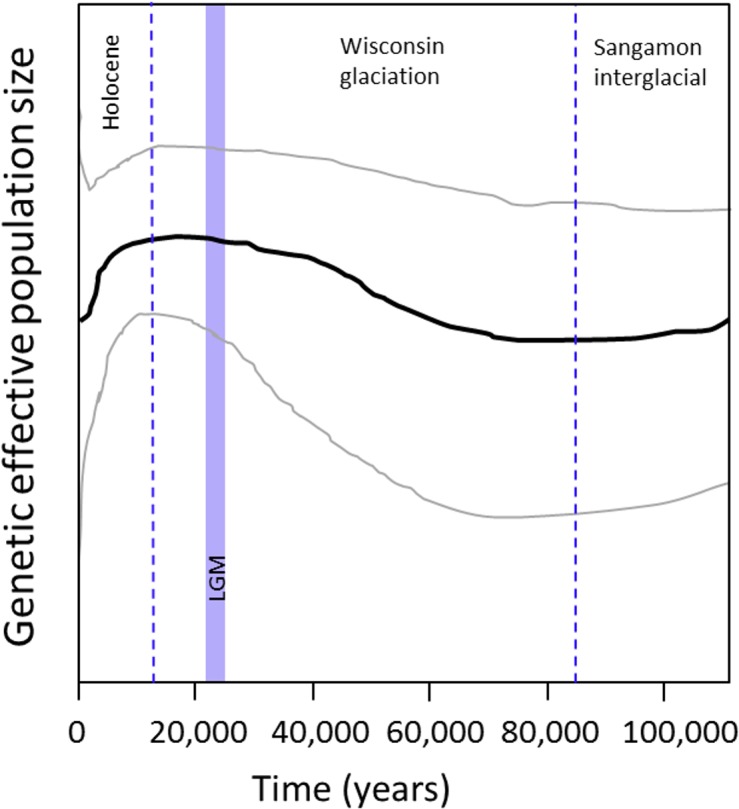
The black line represents the median population size, while the lines above and below represent the 95% highest posterior density (HPD). Dashed lines indicate glacial-interglacial boundaries and the blue shaded rectangle indicates the last glacial maximum (LGM) for reference to the population sizes. The estimated root height (coalescence time) was 96,860 years (95% HPD: 55,318–144,274 years) or 48,380 generations (assuming a 2-year generation time).