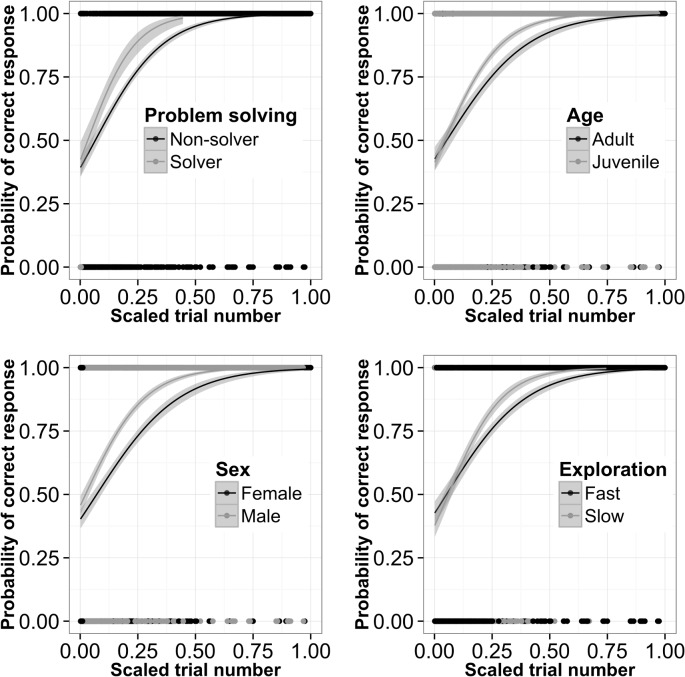
Fig 3. Probability of correct responses (red choices) over successive trials (scaled trial number; see text for details) in free-ranging great tits, with 95% confidence intervals around the GLM logistic curve.
(a) non-solvers vs. solvers; (b) adults vs. juveniles; (c) females vs. males; and (d) fast explorers vs. slow explorers. Note that exploration score was analysed as a continuous variable but was split into 50% slower birds vs. 50% fastest explorers for illustration purposes.

