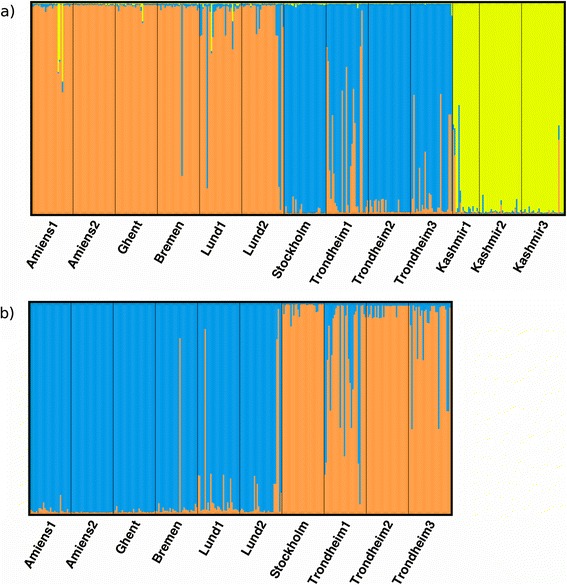
Fig. 2.

Results of the STRUCTURE analysis under the admixture model. Each individual is represented by a vertical line, with different colours corresponding to the different clusters to which a given individual has been assigned, and with the height of each colour corresponding to the amount of the genetic diversity assigned to that cluster. Results of analysis for a) full data set at K = 3, b) European individuals at K = 2
