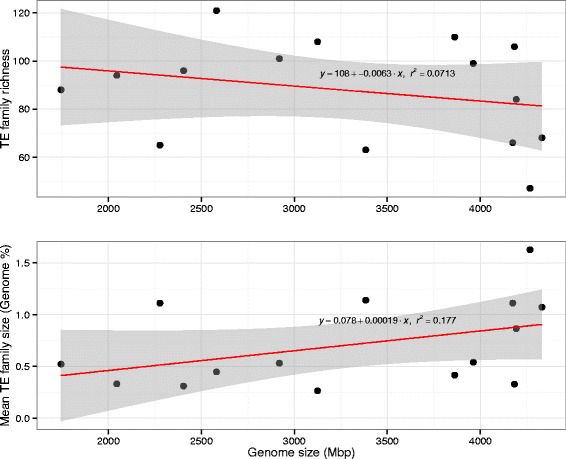
Fig. 6.

Relationship between genome size and TE family size and richness. Along the x-axis is shown the genome size of each species in mega-base pairs. a The TE richness, or total number of TE families seen, is shown along the y-axis. b The mean TE family size as a percent of the genome is depicted on the y-axis
