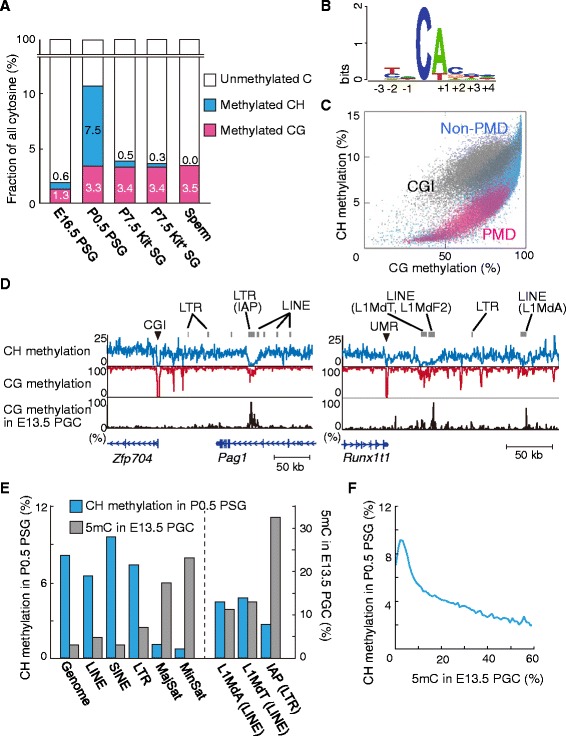
Fig. 2.

High levels of CH methylation in neonatal PSGs. a Proportions of methylated cytosines at CG and CH sites, and unmethylated cytosines at all sites. The nonconversion rate was subtracted from the level of methylated cytosine at CG and CH sites, assuming that it occurred randomly at any unmethylated cytosine. b Sequence context of methylated CH in P0.5 PSGs. c A scatter plot showing correlations between the levels of CH and CG methylation in P0.5 PSGs. Each dot represents both levels in a 50 kb window. The 50 kb regions were classified into those containing any CGI (almost all of which are non-PMD regions; gray) and those without CGI, and the latter were further classified into PMD (red) or non-PMD regions (blue). d Discrepancy between the CG and CH methylation levels observed at some retrotransposons. The CH (top) and CG methylation (middle) levels in P0.5 PSGs are compared with the CG methylation levels in E13.5 PGCs (bottom) across two genomic regions. An LTR (IAP) (left panel) and LINE copies (right panel) have high levels of CG methylation but very low levels of CH methylation in PSGs. These retrotransposon copies are more CG methylated than the adjacent regions in PGCs. The methylation levels were determined in 500 bp windows. Regions marked with arrowheads are CGI or unmethylated region (UMR). e The CH methylation levels in P0.5 PSGs (blue bar) and the CG methylation levels in E13.5 PGCs (gray bar) in the whole genome and repeat sequences. The levels of the major and minor satellite repeats were calculated from reads aligned to the consensus sequences, while those of the other sequences were calculated from reads uniquely aligned to the reference mouse genome (mm10). f Negative correlation between the CH methylation levels in P0.5 PSGs and the CG methylation levels in E13.5 PGCs. The methylation levels were calculated in 5 kb windows
