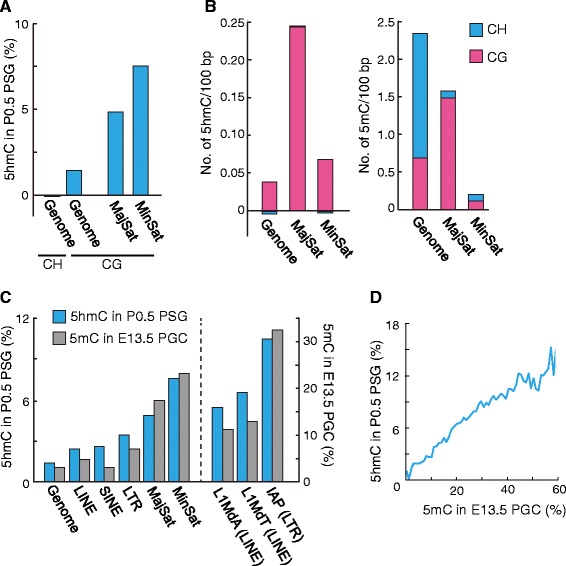
Fig. 3.

Distribution of 5hmC in P0.5 PSGs. a 5hmC levels in the whole genome and satellite repeats. The levels in the major and minor satellite repeats were calculated from sequence reads aligned to the consensus sequences. The levels in the whole genome were calculated from reads uniquely aligned to the reference mouse genome (mm10). b Densities of 5hmC and 5mC (per 100 bp) in the whole genome and major and minor satellite repeats. The proportions of 5hmCs/5mCs at CG and CH sites are also shown. c The 5hmC levels of the whole genome and repeat sequence in P0.5 PSGs (blue bar) and the 5mC levels of those in E13.5 PGCs (gray bar). The levels of the satellite repeats were calculated from reads aligned to the consensus sequences, while those of the other sequences were calculated from reads uniquely aligned to the reference mouse genome (mm10). d Positive correlation between the 5hmC levels in P0.5 PSGs and the 5mC levels in E13.5 PGCs. The levels were calculated in 5 kb windows
