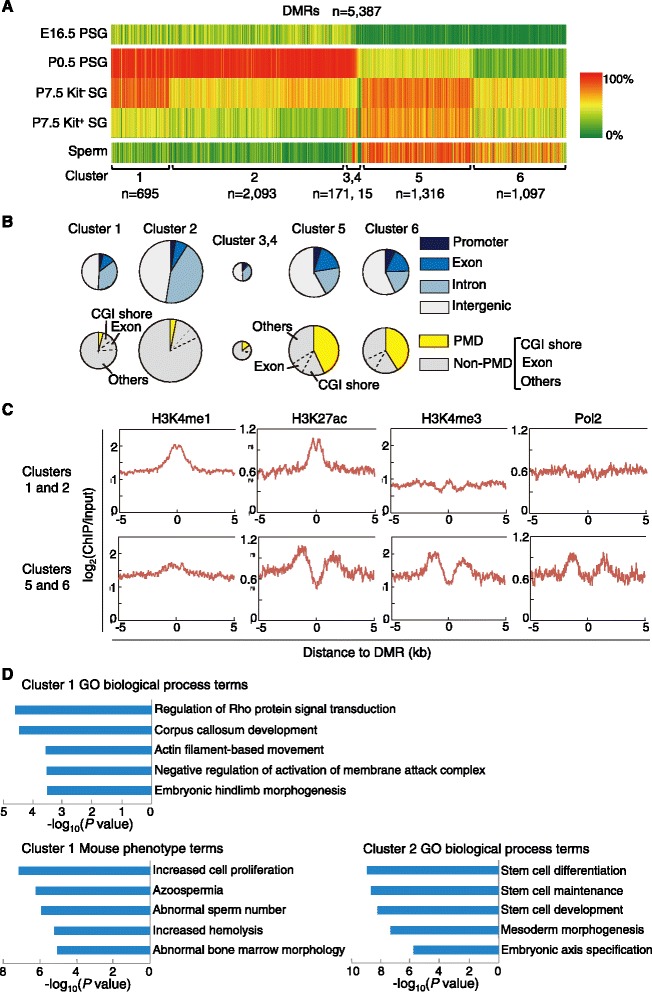
Fig. 4.

Identification and characterization of stage-specific DMRs. a A heat-map representation of the changes in CG methylation at the DMRs identified in the transitions from P0.5 PSGs to P7.5 Kit− SGs and from P7.5 Kit− SGs to Kit+ SGs. The color gradation (from green to red, with an intermediate in yellow) shows the methylation levels (from low to high). The six DMR groups identified by cluster analysis using the changing methylation patterns are shown. The methylation levels in E16.5 PSGs and mature spermatozoa are also shown for comparison. b Genomic locations of the DMRs of each cluster relative to the gene structure (top) or PMD/non-PMD regions (bottom). The DMRs in non-PMD regions are further subdivided based on whether they overlap with CGI shores (2 kb from the edge of a CGI) or exons. The circle size represents the number of DMRs. c Levels of H3K4me1, H3K4me3, H3K27ac, and RNA polymerase II (Pol2) relative to the DMRs in the adult mouse testis [50]. The data are shown for combined cluster-1 and −2 DMRs and combined cluster-5 and −6 DMRs. d GO biological process and mouse phenotype terms enriched for the DMRs of clusters 1 and 2 by GREAT analysis
