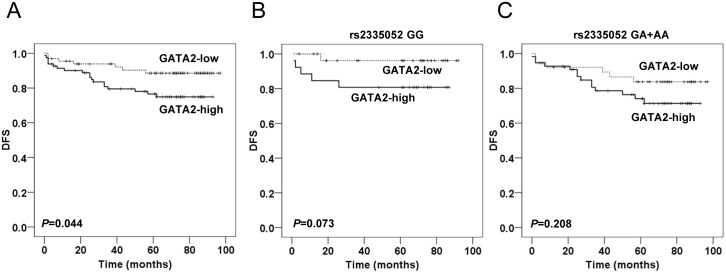
Fig 5. Kaplan-Meier analysis of DFS according to GATA2 expression.
(A) Kaplan-Meier survival curve showed DFS for patients with GATA2-high tumors versus patients with GATA2-low tumors. Kaplan-Meier survival curves showed DFS for patients stratified by GATA2 rs2335052 GG (B), and GG+AA (C) genotypes. The log-rank test was used to calculate P values.

