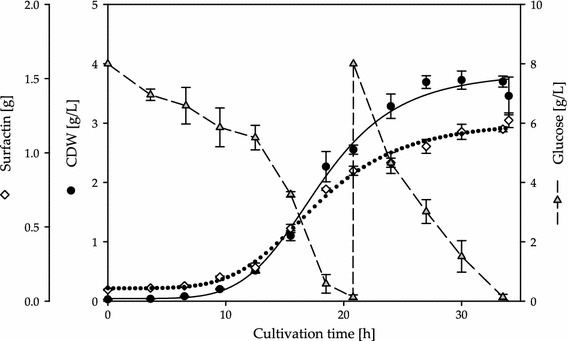
Fig. 2.

Time course of the fed-batch fermentation of B. subtilis DSM 10T employing medium C. The time courses of CDW (black dot, [g/L]), Surfactin (white rhombus, [g]) and glucose (grey triangle, [g/L]) are displayed as mean values of two fermentations. Glucose was added after its complete consumption (23 mL of 450 g/L glucose, 20.83 h after inoculation). The dotted and solid lines represent logistic fits of CDW and mass of Surfactin
