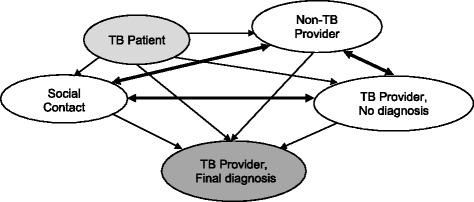
Fig. 1.

Conceptual Model of Social and Provider Contacts in TB Patients’ Diagnostic Pathway. Legend: The TB patient (lighter grey) initiates movement through the network. Solid lines are directional and indicate the types of movement between contacts in the network; heavier lines have double arrows representing bidirectional movement allowing for iterative paths and loops in the networks. The TB provider making the final diagnosis (darker grey) represents the absorbing step for all movements
