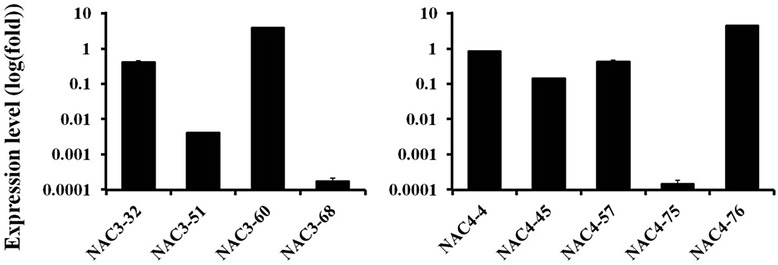
Fig. 6.

Expression level of CiNAC3 or CiNAC4 in their overexpression lines. The T3 transgenic plants growing under normal condition was detected by relative quantitative real-time PCR. There was no amplification in Col-0. Expression values were calculated using 2-ΔCT method and AtEF1α as endogenous control. Two independent biological replicates were performed with similar result.Three technical replicates of each biological replicate were analyzed in quantitative real-time PCR analysis
