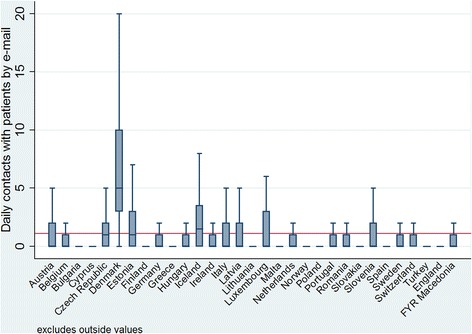
Fig. 2.

Box plot of the number of daily email contacts per country. Variability among the 31 European countries of the QUALICOPC survey: within countries (dimension of the boxes, position of the median and upper and lower quartiles) and among countries (comparison among boxes). Base: All GPs. Indicator: question “Daily contacts”. Source QUALICOPC, 2013
