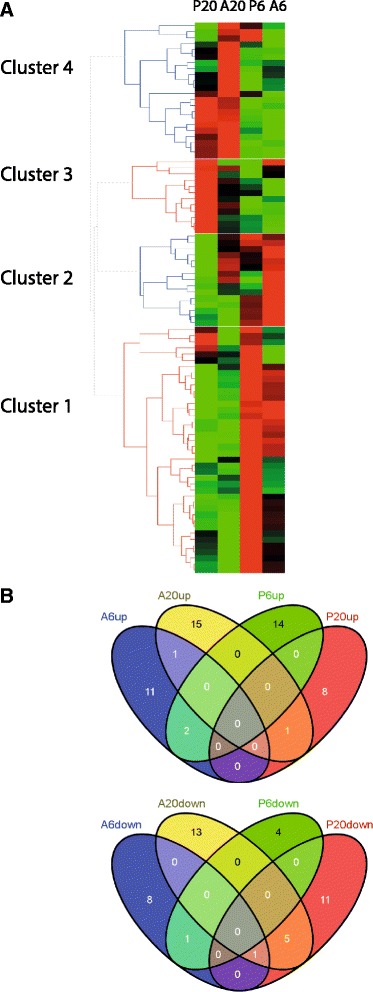
Fig. 3.

Differentially expressed pea immune signalling candidate genes. a Hierarchical clustering of differentially expressed genes (P ≤ 0.05, ≥ 1.5 fold induction or ≤ 0.67 fold repression) that corresponds to pathogen perception and signalling during early time of interaction with A. euteiches and P. pisi. The clustering is generated by HCE3.5 software with the complete linkage method and the Manhattan distance measure. Red and green represent up regulated and down regulated genes, respectively. P6 and P20 correspond to infection by P. pisi at 6 and 20 hpi, while A6 and A20 correspond to infection by A. euteiches at 6 and 20 hpi, respectively. The overlap between (b) up regulated and (c) down regulated gene sets associated with immune signalling is shown
