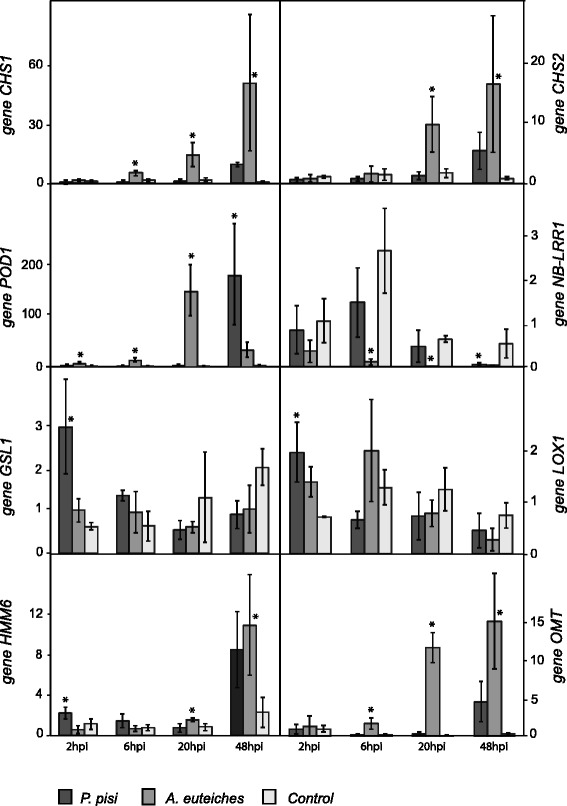
Fig. 6.

Expression profiles of selected pea genes during interaction with A. euteiches and P. pisi. Relative expression levels were normalized by β-tubulin (TUB) expression, and presented in relation to control pea plants at 2 hpi (= expression level 1) using the 2-∆∆Ct formula. Error bars represent standard deviation based on at least 4 biological replicates. Asterisks indicate statistically significant (P ≤ 0.05) differences between infection treatments and control plants within time points according to the Fisher test. Abbreviations: chalcone synthesis (CHS1, CHS2), peroxidase (POD1), nucleotide binding - leucine rich repeat resistance (NB-LRR1), callose synthase (GSL1), lipoxygenase (LOX1), 6a-hydroxymaackiain methyltransferase (HMM6) and O-methyltransferase (OMT)
