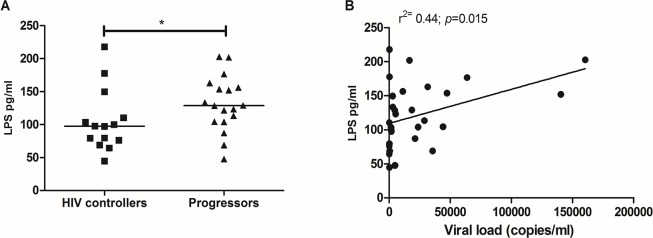
Fig 5. Plasma LPS levels.

(A) Comparison of the plasma levels in pg/mL of LPS in HIV controllers and progressors measured by the LAL assay and (B). The black line represents the median. A Mann Whitney test was used with a confidence level of 95%. Significant differences are indicated at the top of the figure. (*p<0.05).
