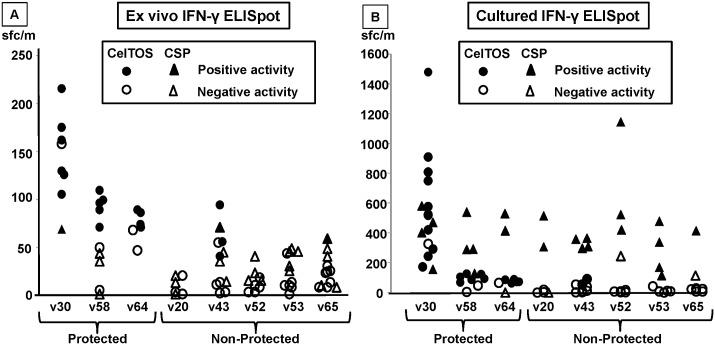
Fig 6. Antigen-specific IFN-γ ELISpot activity of protected and non-protected RAS-immunized volunteers targeting CelTOS and CSP.
CelTOS (circles) and CSP (triangles) overlapping peptide pools spanning full length CSP or CelTOS were used to stimulate T cell responses of three protected (v30, v58, v64) and five non-protected (v20, v43, v52, v53, v65) RAS-immunized subjects, and responses were measured by IFN-γ ELISpot, and expressed as spot-forming cells/million PBMC (sf/m). A. In ex vivo assays, samples were scored as positive (filled markers) using high stringency criteria (significant difference between test antigen and medium controls using Student’s t-test, at least a doubling and a difference of at least 10 sfc/m (See Methods) or as negative (open markers). Occasional values of activities that were negative exceeded positive values if the pre-immunization activities were high. Overall, the CelTOS-specific T cell responses among protected subjects (geometric mean 98 sfc/m) were significantly higher than the CelTOS-specific T cell responses of non-protected subjects (geometric mean 12 sfc/m, p = <0.001, Mann-Whitney U test), whereas CSP-specific T cell responses were similar among protected (geometric mean 18 sfc/m) and non-protected (geometric mean 11 sfc/m, not significant) subjects. B. In cultured ELISpot assays, CelTOS-specific T cell responses of protected subjects (geometric mean 505 sfc/m) were also significantly higher than non-protected subjects (geometric mean 157 sfc/m, p = 0.002, Mann-Whitney U test). CSP-specific T cell responses of protected subjects (geometric mean 215 sfc/m) were similar to those of non-protected subjects (geometric mean 235 sfc/m, not significant).

