
Fig 2. Results of the multiple regression analysis between the central executive network and the scores on the posttraumatic growth inventory (PTGI).
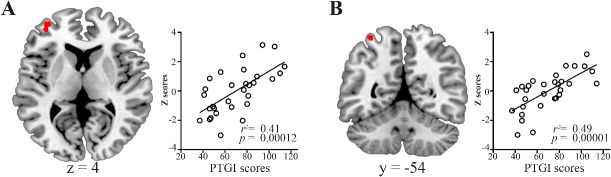
Brain regions showing positive correlations between the PTGI scores and the strength of the central executive network activity as determined by multiple regression analysis. The scatter plots show the association between the PTGI scores and the strength of the central executive network activity. A, rostral prefrontal cortex; B, superior parietal lobule. The statistical threshold for the contrasts was voxel-level p < 0.001 uncorrected for height and cluster-level p < 0.05 corrected for multiple comparisons.