
Fig. 2.
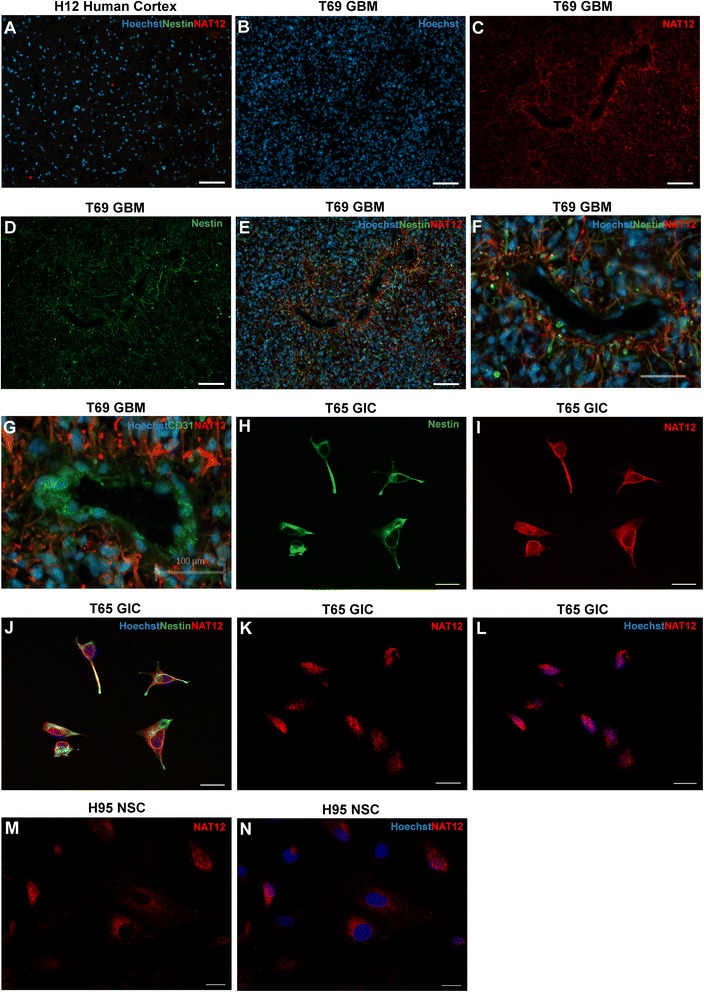
Immunolabeling with anti-NAT12/NAA30 antibody performed on GIC and NSC cultures, GBM tissues and brain tissue. a, Immunolabeling of a biopsy from normal human cortex shows no expression of NAT12/NAA30 (red) and nestin (NES, green). b, Hoechst staining showing high nuclear density in a GBM biopsy. c, Immunolabeling of NAT12/NAA30 (red) in a GBM biopsy. d, Immunolabeling of NES (green) in a GBM biopsy. e, Extensive staining of both NAT12/NAA30 (red) and NES (green) in a GBM tissue specimen. f, NAT12/NAA30 positive cells are abundant around vessels. g, Co-staining of NAT12/NAA30 (red) and CD31 (green) confirms that NAT12/NAA30 cells are located in the perivascular niche of the tumor. Scale bar is 100 μm. h-j, Confocal images of NAT12/NAA30 immunolabeling show that NES (green) and NAT12/NAA30 (red) is co-expressed in GICs. NES is present in the cytoplasm and NAT12/NAA30 is also found in the nuclei. Scale bar is 20 μm. k-n, Confocal images showing cellular expression pattern of NAT12/NAA30 (red) in GIC– and NSC cultures. NAT12/NAA30 (red) is predominantly located in the cytoplasm of NSCs but is consistently present in the nuclei in GIC cultures depicted by the overlap with Hoechst (blue). Scale bar is 20 μm