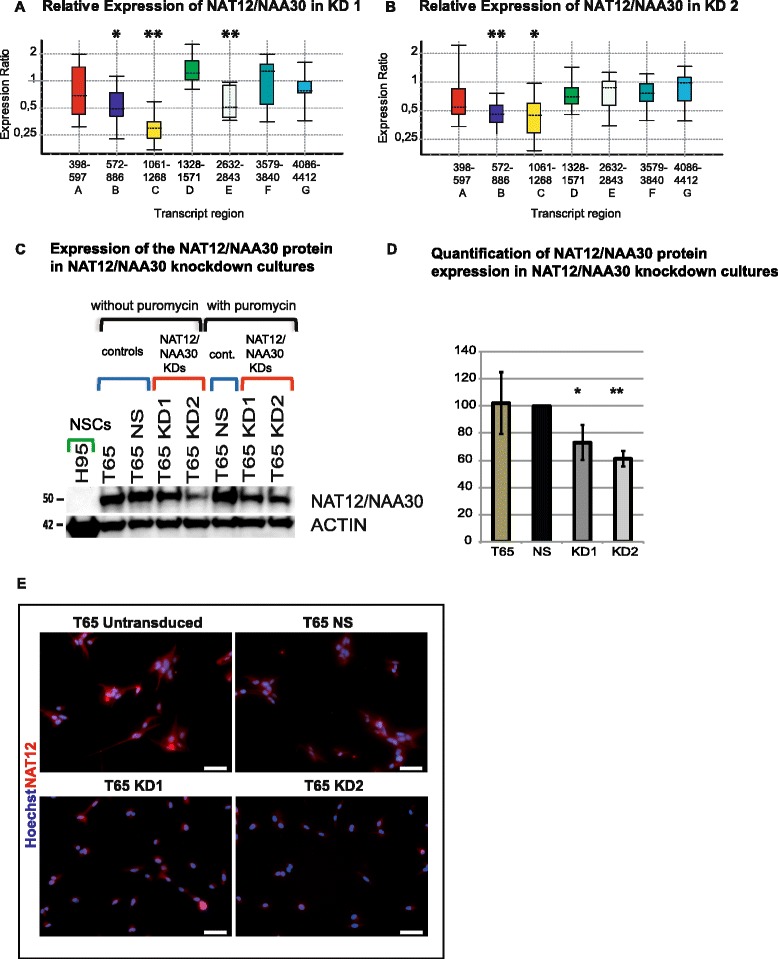
Fig. 3.

Confirmation of NAT12/NAA30 gene knockdown at RNA and protein level. a-b, Box and whiskers plot of gene expression as measured by qPCR. The bottom and top of each box indicate the 25th and 75th percentile (the lower and upper quartiles, respectively), and the band near the middle of the box is the 50th percentile (the median). The ends of the whiskers represent the minimum and maximum of all the data. a, Relative expression of NAT12/NAA30 in KD1 culture was analysed using seven sets of oligonucleotides designed to cover the whole transcript (for oligonucleotide position see Fig. 1e). Relative expression (RE) calculated by normalization to the NS culture and the statistical parameters. P values in this experiment were as follows p(A) = 0.35, p(B) = 0.011, p(C) = 0.001, p(D) = 0.146, p(E) = 0.001, p(F) = 0.915, and p(G) = 0.367. Asterisks correspond to p values and indicate level of significance. * = (p ≈ 0.01-0.05), ** = (p ≈ 0.001-0.01), *** = (p ≈ 0.0001-0.001), **** = (p < 0.0001). Additional details of the statistical analysis can be found in Additional file 4. b, The same for KD2 culture. P values in this experiment were as follows: p(A) = 0.368, p(B) = 0.002, p(C) = 0.019, p(D) = 0.099, p(E) = 0.256, p(F) = 0.167, and p(G) = 0.61. Asterisks correspond to p values and indicate level of significance. Additional details of the statistical analysis can be found in Additional file 4. c, Western blot showing knockdown of NAT12/NAA30 protein in KD1 and KD2. d, Quantification of the protein expression from western blots (average of three blots with two different antibodies) showing relative expression of NAT12/NAA30 protein in knockdown cultures KD1 and KD2 compared to the controls, NS and T65 untransduced. e, Immunolabeling showing expression of NAT12/NAA30 (red) in the two controls, T65 untransduced and T65 NS and reduced protein levels in KD1 and KD2. Scale bar is 50 μM
