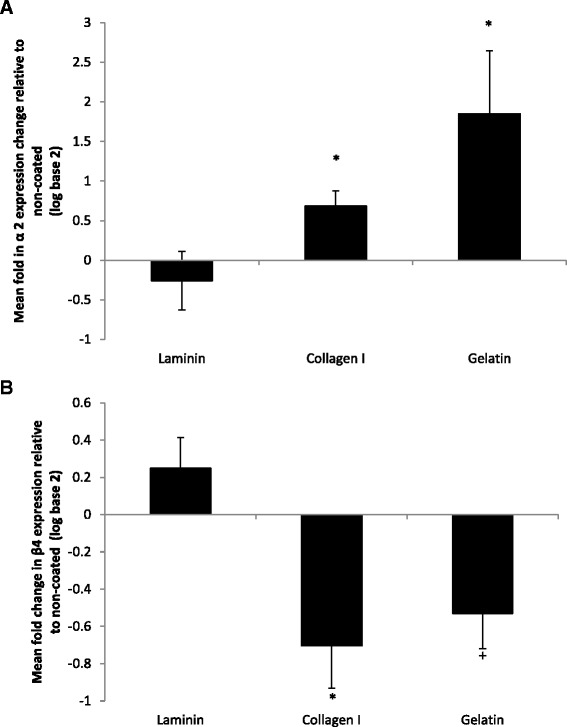
Fig. 6.

Expression of a α2 and b β4 integrin subunit ECM receptors following culture of HSC-T6 on laminin, collagen I and gelatin ECM proteins relative to the expression levels of those grown on non-coated T25 culture flasks. *Denotes significant difference from non-coated control at P < 0.05 according to one-way ANOVA with Tukey’s post hoc test; + denotes significant difference from non-coated control at P < 0.05 according to t test assuming equal variances. The results represent the mean of three experiments ±SD
