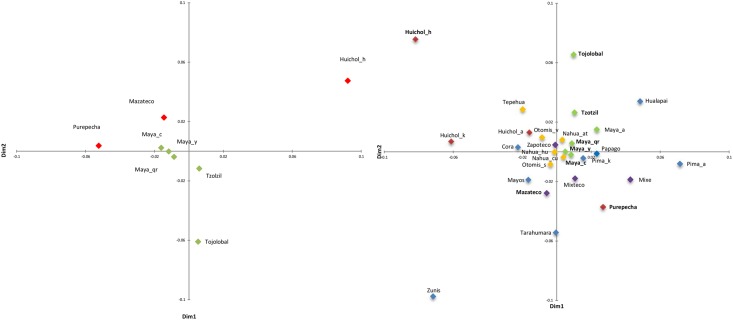
Fig 2. MDS plot representing Fst distances between Native American groups based on mtDNA D-loop region.
Bold letters denote the indigenous groups studied herein. a) MDS plot for eight Native Mexican groups; b) MDS plot for 28 Native American groups. Colors indicate the cultural regions to which the populations belong: green, Maya region; blue, North; red, West; yellow, Center; and purple, Oaxaca. Bold letters indicate Mexican indigenous groups included in this study.

