Fig. 3.

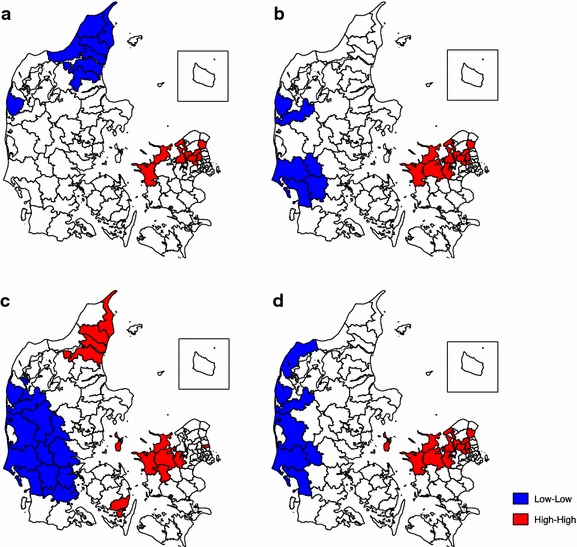
Local Moran’s I clustering of the incidence proportion of a diagnosis, b medication use, c medication use and no registered diagnosis, d overall ADHD by municipality (red hot spots, blue cold spots)

Local Moran’s I clustering of the incidence proportion of a diagnosis, b medication use, c medication use and no registered diagnosis, d overall ADHD by municipality (red hot spots, blue cold spots)