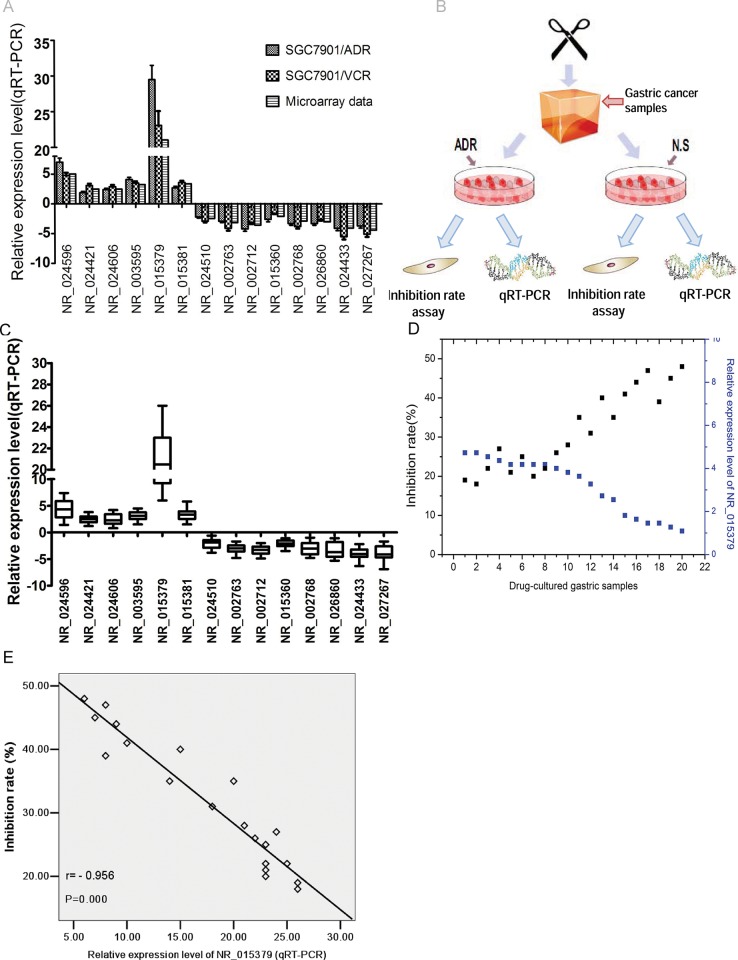
Fig 6. LncRNA chosen randomly for examination using qRT-PCR assay.
(A) Sixteen lncRNAs expression levels in SGC7901/ADR and SGC7901/VCR celllines compared with SGC7901 celline. (B) Schematic diagram of gastric cancer samples treated with HDRA followed by qRT-PCR and inhibition rate assay.(C) Sixteen lncRNAs expression levels in twenty gastric cancer samples treated with ADR compared with control groups.(D-E) lncRNA NR_015379 expression levels were negatively correlated with the inhibition rates of gastric cancer samples treated with ADR.

