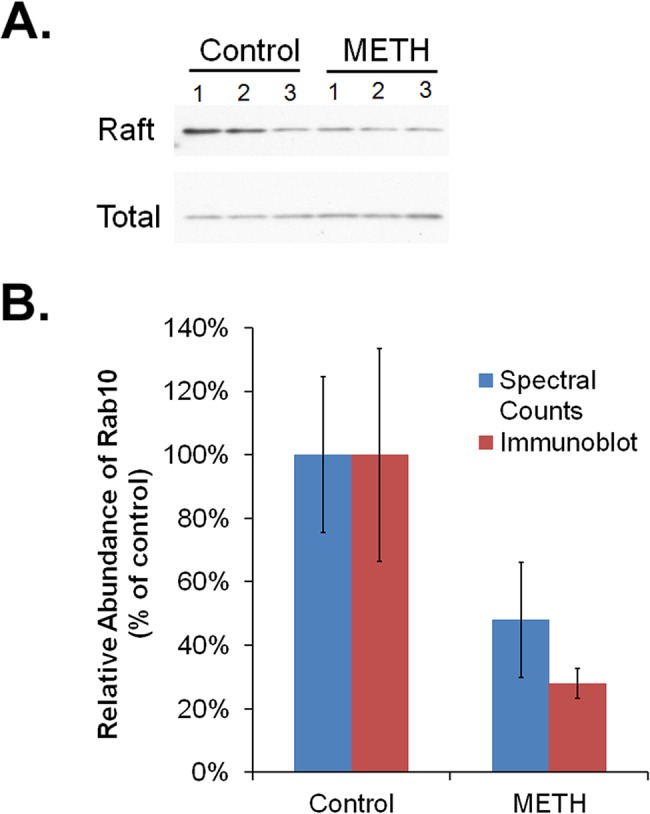
Fig 2. Decreased Rab10 localization in raft fractions following methamphetamine treatment.

(A) Immunoblot analysis of Rab10 abundance in striatal membrane raft fractions (Raft) and total homogenates (Total) from rats treated with methamphetamine (2 mg/kg, i.p.; METH) or saline (Control), followed by density gradient centrifugation to separate raft from non-raft samples. (B) Spectral counting data for Rab10 and densitometric analysis of the immunoblots (optical density). Densitometry of Rab10 was normalized to Rab10 in total homogenates. Results shown are the mean ± SEM, expressed as a percentage of the mean control value. For spectral counting, p < 0.05 and t = 5.18 (unpaired two-tailed Student’s t-test, n = 4). For immunoblot densitometry, p = 0.10 and t = 2.92 (unpaired two-tailed Student’s t-test, n = 3).
