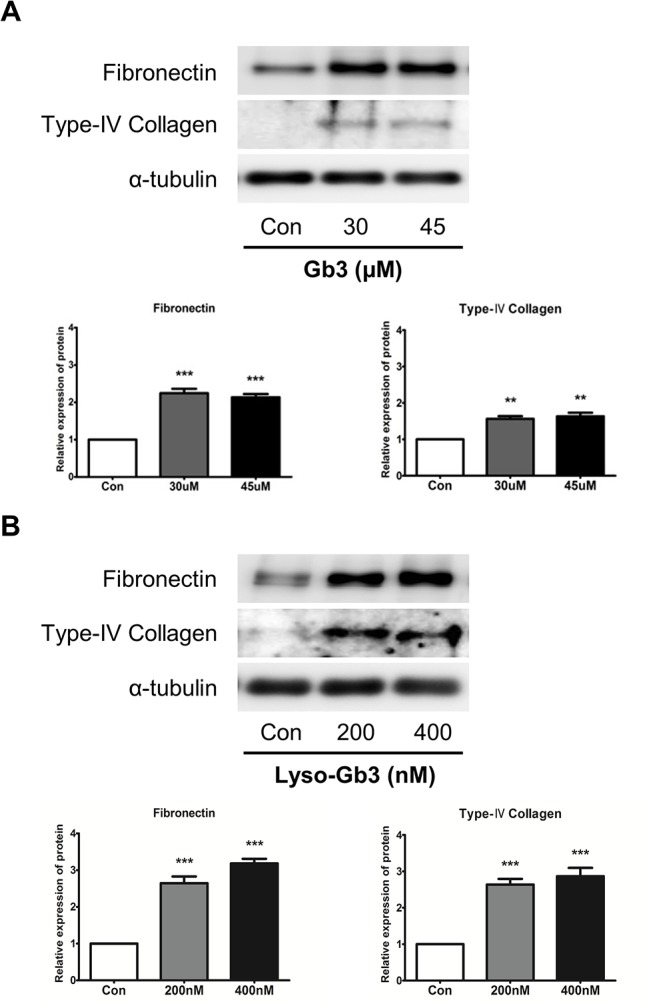
Fig 3. Effects of Gb3 and lyso-Gb3 treatments on ECM component expression in HK2 cells.

(A) Immunoblotting analysis of fibronectin and type IV collagen following Gb3 (30 μM and 45 μM, respectively) treatment of HK2 cells for 72 h. (B) Immunoblotting analysis of fibronectin and type IV collagen following lyso-Gb3 (200 nM and 400 nM) treatment of HK2 cells for 72 h. Panels (A) and (B) show a representative experiment (bottom panel) and data as mean ± SEM, n = 3. Gb3 or lyso-Gb3 vs control, One-way ANOVA. * P < 0.05, ** P < 0.001, and *** P < 0.0001.
