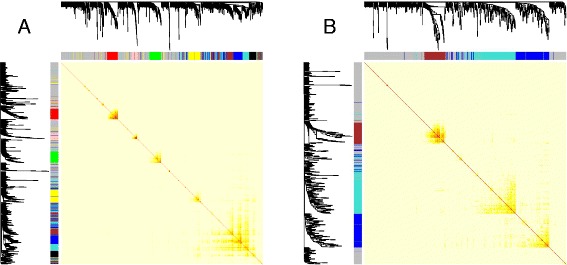
Fig. 2.

Co-expression networks among genes up-regulated in high-risk CRPC patients (a) and genes down-regulated in high-risk CRPC patients (b) are constructed from whole blood mRNA profiling of 437 male samples in the IFB dataset. Light color represents low overlap and progressively darker red color represents higher overlap. The gene dendrogram and module assignment are shown along the left side and the top. Each color represents one module, and a grey color represents genes that are not assigned to any modules
