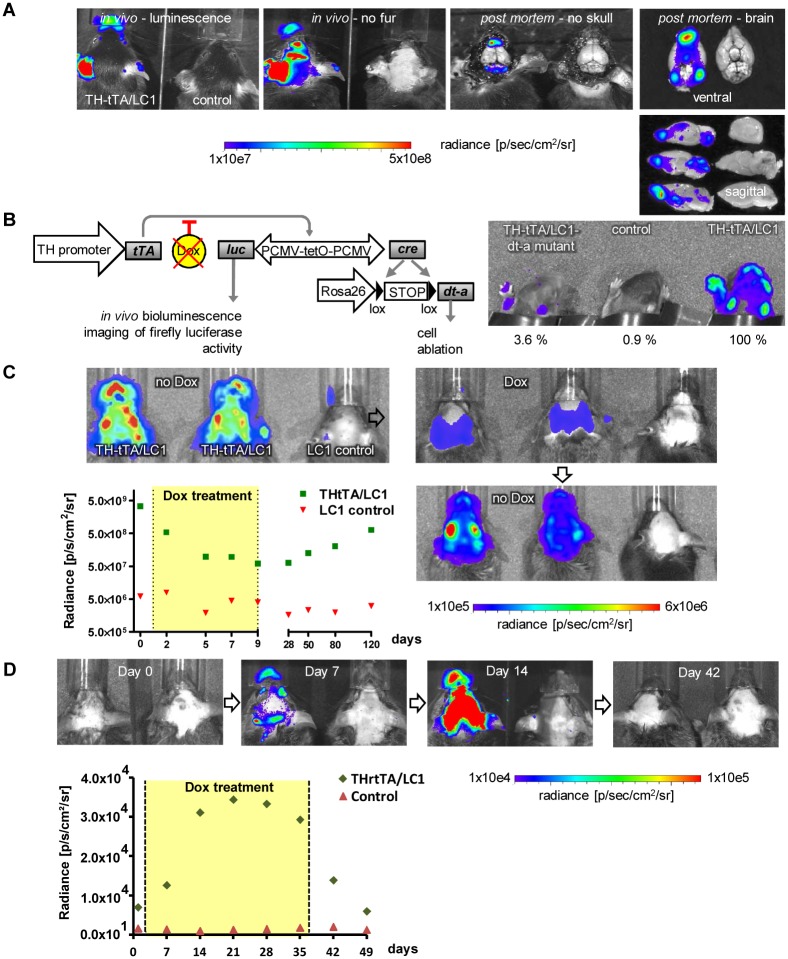
Fig 5. In vivo bioluminescence imaging of DA neurons in TH-tTA/LC1 and TH-rtTA/LC1 mice.
(A) Detection of luciferase activity in anesthetised TH-tTA/LC1 and LC1 control mice after fur removal and in brain tissue of dead mice after removal of the skull and dissection of brains using an IVIS200 in vivo imaging device (Calipers Co.). (B) Comparison of the in vivo bioluminescence signals in P3 TH-tTA/LC1 mouse pups expressing diphteria toxin A (dt-a) with TH-tTA/LC1 control mice and LC1 mice without luciferase expression. The radiance [p/sec/cm2/sr] RAW data luminescence signal intensity is shown in percentage compared to the maximal signal in the TH-tTA/LC1 control mice. (C) Temporal control of bioluminescence signal via DOX treatment in TH-tTA/LC1 mice. Quantification of luciferase activity in anesthetised TH-tTA/LC1 and LC1 control mice. After initial measurement, mice were treated with DOX in the drinking water (2 mg/ml) for 8 days and afterwards kept without DOX for further 111 days. Bioluminescence was again measured at the indicated time points, n = 3. (D) Temporal control of bioluminescence signal via DOX treatment in TH-rtTA/LC1 mice. Quantification of luciferase activity in anesthetised TH-rtTA/LC1 and LC1 control mice raised on DOX for 6 weeks and kept during adulthood without DOX. After initial measurement, mice were treated with DOX-containing food for 35 days and afterwards kept without DOX for further 14 days, n = 3–8.

