
Fig. 2.
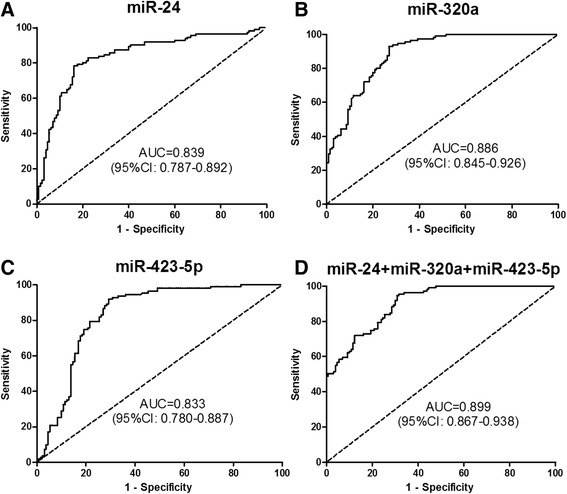
ROC curve analyses demonstrating that plasma levels of miR-24, miR-320a, and miR-423-5p are different among patients with CRC, benign lesions, and healthy controls. (a-c), ROC curves showing plasma levels of miR-24, miR-320a, and miR-423-5p in CRC patients are different from healthy controls. (d), Combination ROC curve analyses of the three microRNAs between CRC patients and healthy controls