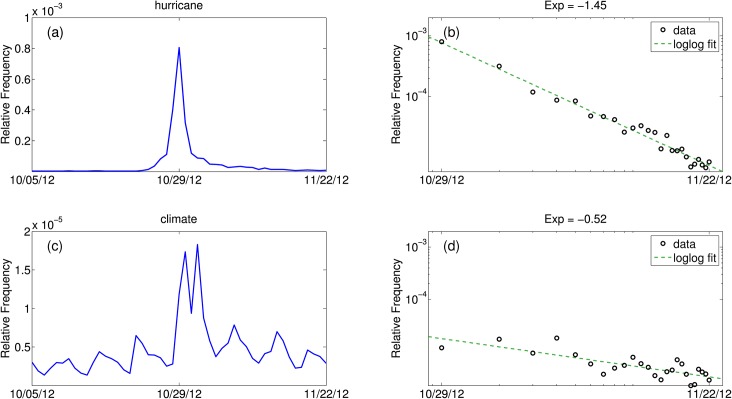
Fig 8. Decay rates of the words “hurricane” (top) and “climate” (bottom).
The left plots gives the time series of each word during hurricane Sandy. The right plots gives the power law fit for the decay in relative frequency, x-axes are spaced logarithmically. The power law exponents are given in the titles of the figures.

