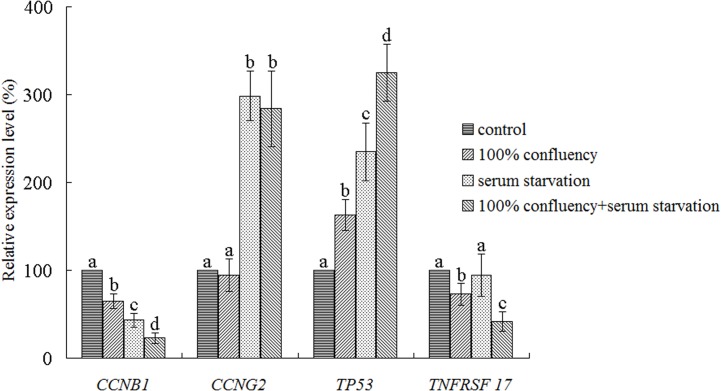
Fig 3. The Relative Expression of Cell Cycle-Related Genes was Assayed by Real-Time RT PCR.
The expression of genes in each group was normalized to the control group. Data were collected from three replicates and are presented as the mean±standard deviation. Bars with different lowercase letters are significantly different (p<0.05).

