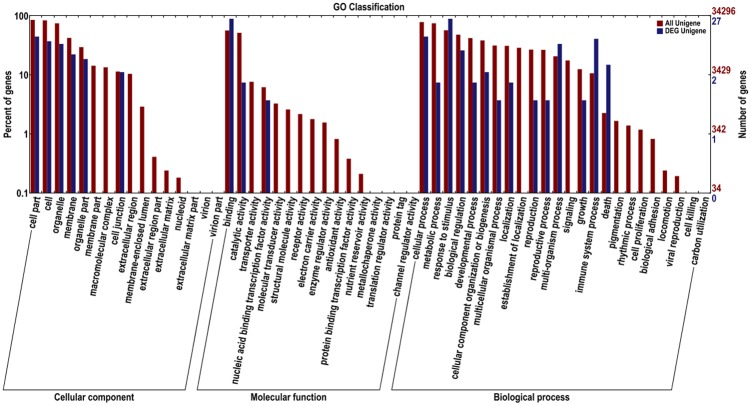
Fig 5. Functional annotation of 28 genes related to pear black spot resistance based on Gene Ontology (GO) analysis.
GO analysis was performed for three main categories (cellular component, molecular function and biological process). To the left of the ordinate is the percentage of gene quantities, and to the right of the ordinate is the number of genes. Functional annotation of all assembled genes is indicated using a red color column, and the functional annotation of the differentially expressed genes is indicated using the blue color column.

