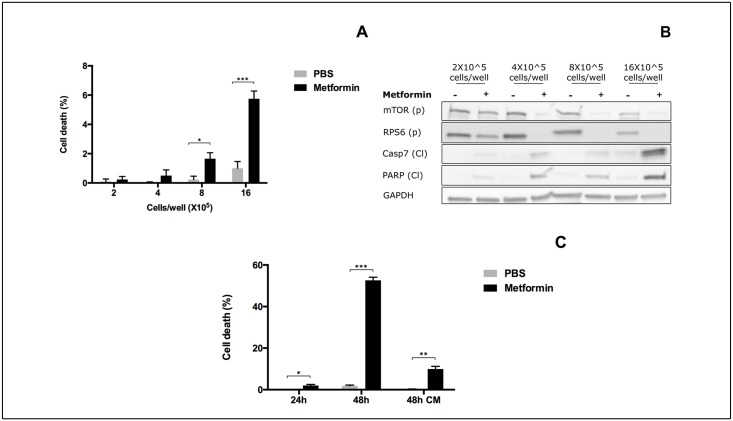
Fig 1. Cell density and nutrient availability influence metformin effect on mTOR pathway and apoptosis.
MCF7 cells were plated in MEM medium at different densities from 2X10⁵ to 16X105 cell/well in 6-well plates. Cells were then treated with 10mM metformin or with PBS as control for 24 hours. A) After treatment cells were collected and counted with Trypan Blue dye to discriminate between dead and alive cells. Results are reported as percentage of dead cells on the number of total cells. The bars represent the mean of three independent experiments. B) Cells were collected after 24 hours treatment and protein extracts were subjected to Western Blot analysis to determine the level of phosphorylation of mTOR (p) Ser2448 and RPS6 (p) Ser240/244. We also monitored the levels of cleaved Caspase7 (Cl) and PARP (Cl). GAPDH was used as loading control. The blot is representative of three independent biological replicates. C) MCF7 cells were plated in MEM medium at a density of 8X10⁵ cells/well and treated with 10 mM metformin or with PBS for 24h, 48h or 48h changing the medium after the first 24h treatment (48h CM). Cells were collected after treatment and counted with Trypan Blue dye to discriminate dead from alive cells. Results are reported as percentage of dead cells over the total number of cells. The bars represent the mean of three independent experiments.

