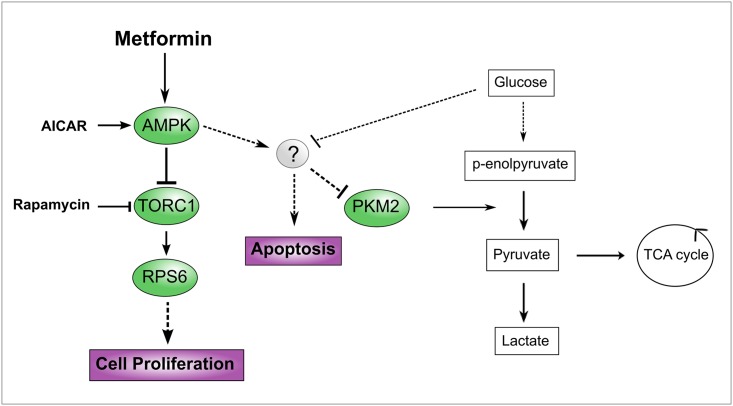
Fig 7. Model consistent with the data presented in this manuscript.
The model represents the logic relationships that are supported by the experimental observations presented here. Solid and broken lines in the left “signalling” part of the model represent direct and indirect interactions, respectively. Activations and inhibitions are depicted as arrowhead and hammerhead. On the right “metabolic” part of the model arrows represents metabolite conversions. The circle with a question mark represents the unknown entity that mediate the downregulation of PKM2 when AMPK is activated at high glucose concentration.

