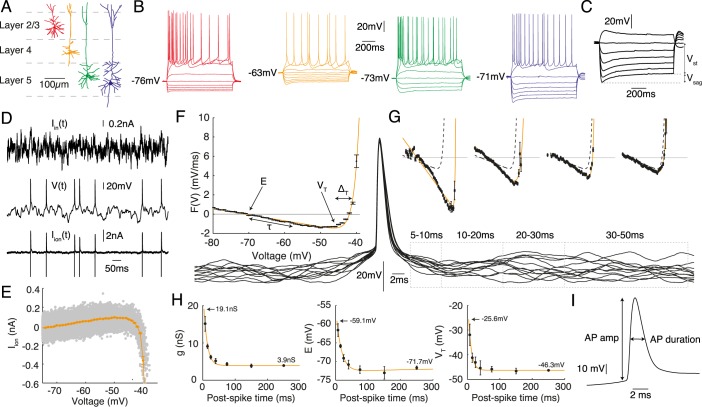
Fig 1.
The four cell classes studied were A layer-2/3 (red), layer-4 (orange), slender-tufted layer-5 (green) and thick-tufted layer-5 (blue) pyramidal neurons. B Representitive intracellular-voltage response to 1 s step currents. C Sag ratio V sag/V st (expressed as a percentage). D-I Parameters measured from the response to fluctuating-current stimulation using the dynamic I − V curve protocol. D A layer-4 pyramidal cell stimulated by fluctuating current I in(t) with the voltage V(t) recorded. The ionic current I ion(t) estimated from the difference between stimulation and capacitance currents. E Scatter plot of I ion versus voltage (grey) and dynamic-I-V curve I dyn (orange) with data 200 ms following each spike excluded. F Steady-state forcing function F(V) = −I dyn/C (black points) with fit (orange) to the exponential integrate-and-fire (EIF) model Eq (2). The roles of the various parameters are illustrated. G Empirical forcing terms (black points) measured in post-spike time slices (spike-triggered voltage traces are shown below) with fits to the EIF model (orange). The steady-state F(V) from panel F is also plotted (dashed lines) for comparison. H Parameter dynamics from the post-spike F(V) fits for conductance g (mono-exponential fit, orange), resting potential E (bi-exponential fit due to weak sag,) and spike-onset threshold V T (mono-exponential fit, orange). Errorbars from bootstrap resampling. I Mean action-potential shape parameters extracted from isolated spikes.

