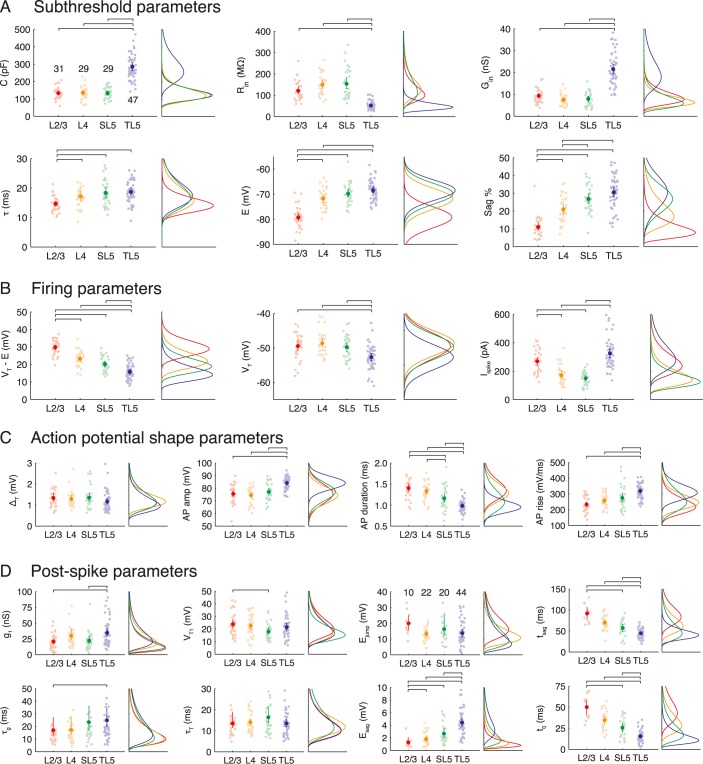
Fig 4.
Quantifying heterogeneity in neocortical pyramidal-cell populations. The parameter groupings are: A subthreshold, B firing, C action-potential shape and D post-spike parameters for each pyramidal-cell class. Left panels show mean value (darker point) and all data (pale points) with error bars (95% bootstrap confidence interval). Horizontal lines denote significant statistical difference (5% confidence, Bonferroni-corrected). Right panels show fitted distributions for each pyramidal-cell class. The n numbers are shown on the first panel and are common to all other panels except the four concerning the resting-potential sag dynamics E for which only those cells with sags were included (n numbers are given in the E jump panel). Note that many parameters correlate with cortical depth.

