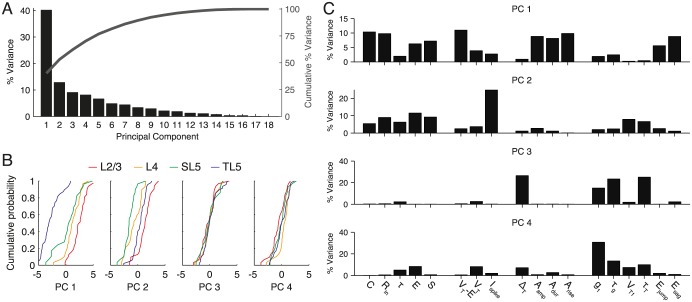
Fig 5. Principal component analysis (PCA) of variation across the entire data set.
A Pareto plot of the percentage of the variance explained by each principal component (black bars), and the cumulative sum of the explained variance (dark grey line). B Empirical cumulative distribution function in PC space for each class and for principal components one to four. C Contribution of each cellular parameter to the variation of the first four principal components. See main text for an interpretation of these results.

