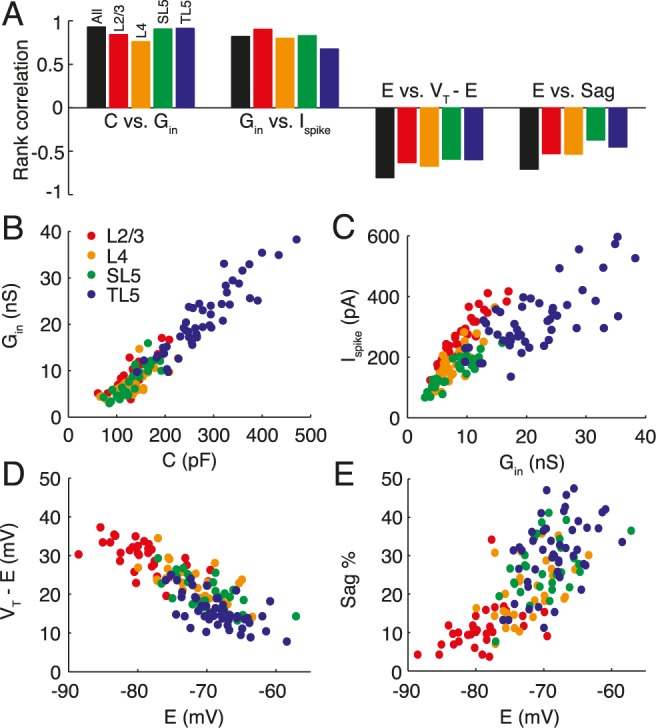
Fig 7. Correlations between pairs of electrophysiological parameters.

A Highly correlated variable pairs for each pyramidal-cell population (see colour key) and across all pyramidal cells (black). Correlations were calculated using Spearman’s rank test. As well as the correlations directly linked to size such as B conductance versus capacitance or, less directly, C the spike-threshold current versus conductance, there are D anti-correlations between the potential difference to threshold and the resting potential and E positive correlations between the sag percentage and resting potential, the latter of which is likely due to a common underlying cause such as h-current expression.
